
Our monthly Market Watch series begins with October 2020. This post fills in what came before it — the nine months that made 2020 the most volatile year the Greater Toronto Area housing market has seen in a generation.
It is written as a look back, not as a contemporaneous report. Every figure below comes from the Toronto Regional Real Estate Board's own monthly Market Watch releases for 2020, linked at the end.
The Short Version
2020 did not trend. It broke in half.
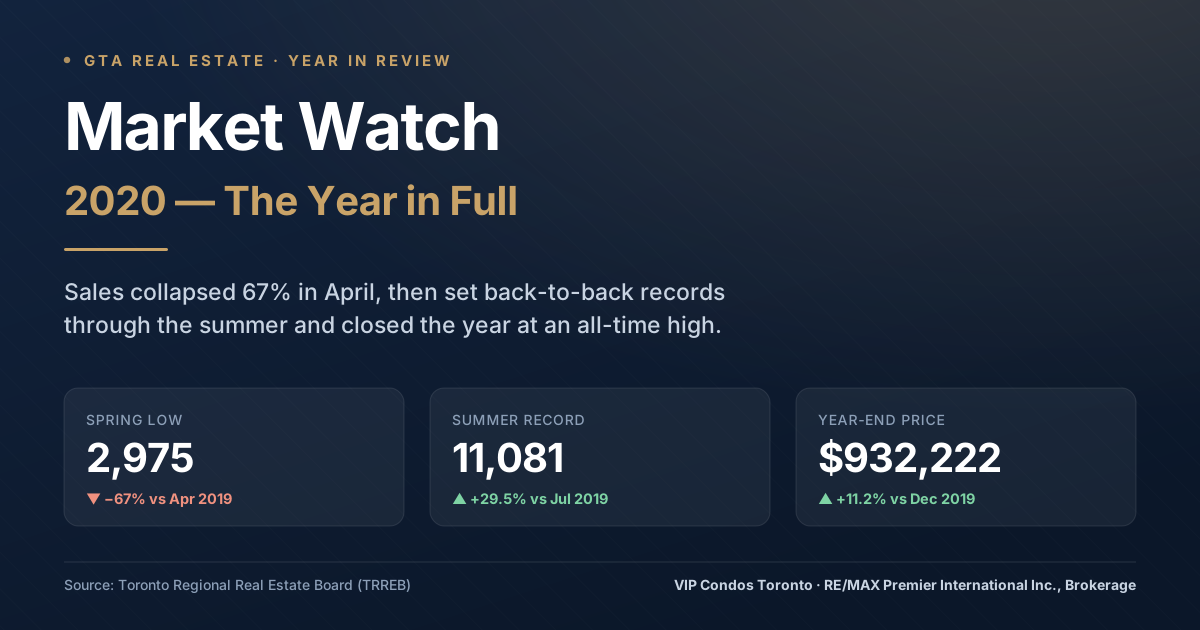
The year opened hot — February sales were up 45.6% over February 2019, and the market was on pace for a record spring. Then, on March 15, everything stopped. April sales came in at 2,975, a 67% collapse against April 2019 and the quietest month the GTA had recorded in decades. Sellers pulled listings almost as fast as buyers disappeared, which is the detail that explains everything that followed.
By July the market was not merely recovering — it was setting records. July's 11,081 sales were the highest ever for that month, up 29.5% year over year. August broke its own record too. And the average selling price never actually fell year over year at any point in 2020. It dipped from $910,290 in February to $821,392 in April, then climbed nearly every month to close December at $932,222.
Why prices held when sales collapsed
This is the part people misremember. The spring shutdown was not a price crash, because supply vanished in lockstep with demand. April new listings fell 64.1% while sales fell 67% — almost perfectly matched. With inventory disappearing at the same rate as buyers, there was no glut to push prices down. The homes that did trade traded at roughly the prices they would have anyway.
Month by Month: January to September 2020
| Month | Sales | Average Price | New Listings |
|---|---|---|---|
| January 2020 | 4,581 | $839,363 | 7,836 |
| February 2020 | 7,256 | $910,290 | 10,613 |
| March 2020 | 8,012 | $902,680 | 14,424 |
| April 2020 | 2,975 | $821,392 | 6,174 |
| May 2020 | 4,606 | $863,599 | 9,104 |
| June 2020 | 8,701 | $930,869 | 16,153 |
| July 2020 | 11,081 | $943,710 | 17,956 |
| August 2020 | 10,775 | $951,404 | 18,491 |
| September 2020 | 11,083 | $960,772 | 20,420 |
April is highlighted as the low point; July as the record month. October, November and December 2020 are covered in their own reports — see the links below.
The Three Phases of 2020
January to mid-March: the spring that never happened
The GTA entered 2020 with genuine momentum. January sales of 4,581 were up 15.4% year over year. February accelerated hard — 7,256 sales, up 45.6%, with new listings growing only 7.9%. That gap between surging demand and flat supply is the classic setup for a seller's market, and prices responded: the February average of $910,290 was a substantial jump from January's $839,363.
March is the month that splits in two. TRREB's own report for March 2020 noted "a clear break in market activity between the pre-COVID-19 and post-COVID-19 periods," with the divide falling on March 15. The month still posted 8,012 sales because the first half was strong. The second half was not.
April and May: the floor
April 2020 is the number worth remembering: 2,975 sales across the entire TRREB region. For context, that is roughly a quarter of what July would deliver three months later. New listings fell to 6,174.
May improved but stayed deeply depressed at 4,606 sales, down 53.7% from May 2019. Critically, the average price rose in May to $863,599 — up from April. Even at the bottom, prices were moving in the wrong direction for anyone expecting a crash.
June to December: the V
June nearly tripled April's volume, reaching 8,701 sales. July hit 11,081 — an all-time record for the month and a 29.5% year-over-year gain, driven, as TRREB noted, primarily by low-rise home types in the regions surrounding Toronto. August set another record at 10,775, up 40.3%. September reached 11,083, and new listings finally surged to 20,420 as sellers who had waited out the spring came to market.
The year finished with December's average price at $932,222 — up 11.2% over December 2019, and up 13.5% from the April trough.
What 2020 Should Teach Buyers and Sellers
- Sales volume and prices are not the same signal. Volume fell by two-thirds and prices did not follow, because supply left the market alongside demand. Watch the ratio of sales to new listings, not sales alone.
- Shocks that suppress supply are not buying opportunities. Buyers who waited for April prices to break got nothing, and then faced a record summer with less inventory and more competition.
- The 416 and the 905 moved differently. The 2020 recovery was led by low-rise homes outside the City of Toronto. Condo demand in the core lagged well into 2021 — the divergence that shaped the next two years.
- Records get set in strange years. July and August 2020 both set all-time monthly records four months after the quietest April on record.
A Note on the Figures
The numbers in the table above are taken from TRREB's original monthly Market Watch reports as published in 2020. TRREB later restates prior-year figures in subsequent releases as late transactions are recorded, so the 2020 comparison figures quoted inside our 2021 monthly reports differ slightly from these — July 2020 sales, for example, were originally published as 11,081 and later restated to 11,033. Both are TRREB figures; they are simply different vintages. We have used the original 2020 publications here because this is a record of what 2020 looked like as it happened.
The Rest of the Series
- Real Estate Market Watch — October 2020
- Real Estate Market Watch — November 2020
- Real Estate Market Watch — December 2020
- The full Market Watch archive, October 2020 to today
This retrospective is for general informational purposes and does not constitute legal, financial, or tax advice. Every situation is different — always consult a licensed real estate professional, lawyer, and tax advisor before making any decisions.
Ready to Take the Next Step?
Create your free, secure account at www.VIPCondosToronto.net for full MLS access, real-time sold data, and VIP pre-construction pricing and floor plans — the same tools our team uses every day.
For personalized advice on your specific Toronto buying or selling situation, contact Frank Merigliano and the VIP Condos Toronto team directly:
Phone: 416-885-0172
Email: frank@vipcondostoronto.net
Web: www.VIPCondosToronto.net
Frank Merigliano, Team Leader / Sales Representative, VIP Condos Toronto, RE/MAX PREMIER INTERNATIONAL INC., Brokerage — licensed since 1993, with RE/MAX since 1995, and a Top 50 RE/MAX team in Canada since 2015.
Sources: Toronto Regional Real Estate Board Market Watch reports for January, February, March, April, May, June, July, August and September 2020.
Have questions?
Want to know more about 2020: The Year the GTA Market Fell Off a Cliff and Climbed Back? Send me a message and I'll get back to you within 24 hours.