
Real Estate Market Watch: Residential Transactions
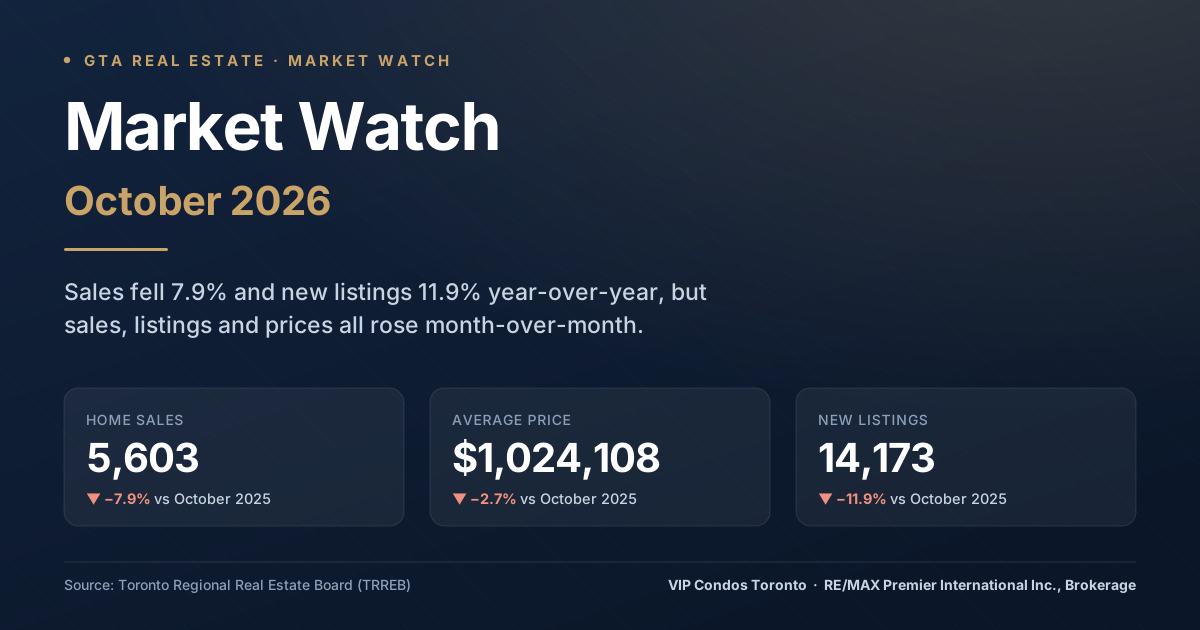
- 5,603 residential home transactions took place across the GTA in October 2026, down from 6,083 in October 2025 — a decrease of 7.9% year-over-year.
- On a seasonally adjusted basis, October sales were up month-over-month compared to September 2026.
- Total dollar volume for the month was just under $5.74 billion.
- The City of Toronto accounted for 2,184 of those sales, with the remaining 3,419 spread across the 905 and the outlying areas. York Region led the 905 with 1,038 sales, followed by Peel Region at 1,017, Halton at 592 and Durham at 589.
- TRREB attributed the pullback to continuing uncertainty around inflation, borrowing costs and the broader economy keeping many buyers on the sidelines.
October 2026 Real Estate News: Average Selling Prices
- The average sale price for October 2026 was $1,024,108. This is a decrease of 2.7% from October 2025, when it was $1,052,539 — a much shallower decline than the 5.1% recorded in September.
- The median selling price was $860,000.
- The MLS® Home Price Index (HPI) Composite benchmark was down 4.3% year-over-year.
- On a seasonally adjusted basis, both the HPI Composite and the average selling price edged up month-over-month compared to September 2026 — a reversal after September, when both slipped.
- In the City of Toronto, the average price was $1,075,627 with a median of $835,000.
Monthly Market Update: New Listings and Inventory
- There were 14,173 new listings in October 2026, an 11.9% decrease from October 2025 (when there were 16,080).
- Active listings at month end totalled 25,098, down 10.0% from 27,899 a year earlier.
- The sales-to-new-listings ratio (trend) was 37.9%, with 4.6 months of inventory — balanced territory, but supply is still withdrawing faster than demand for a second straight month.
- The City of Toronto saw 5,451 new listings and ended the month with 9,526 active listings, a 38.6% sales-to-new-listings ratio and 4.6 months of inventory.
- Unlike September, new listings were up month-over-month on a seasonally adjusted basis, so sellers returned even as the year-over-year count fell.
Real Estate Market Watch for October 2026: Days On The Market
- Properties spent an average of 49 days on the market in total (average PDOM), down from 50 days in October 2025 — a decrease of 2.0%.
- On their current listing, homes took an average of 31 days to sell (average LDOM), unchanged from a year earlier.
- Sellers received an average of 97% of their asking price across the GTA, and 98% in the City of Toronto.
- City of Toronto properties moved faster than the GTA average, at 30 days on their current listing and 45 days in total.
Sales and Average Price by Home Type
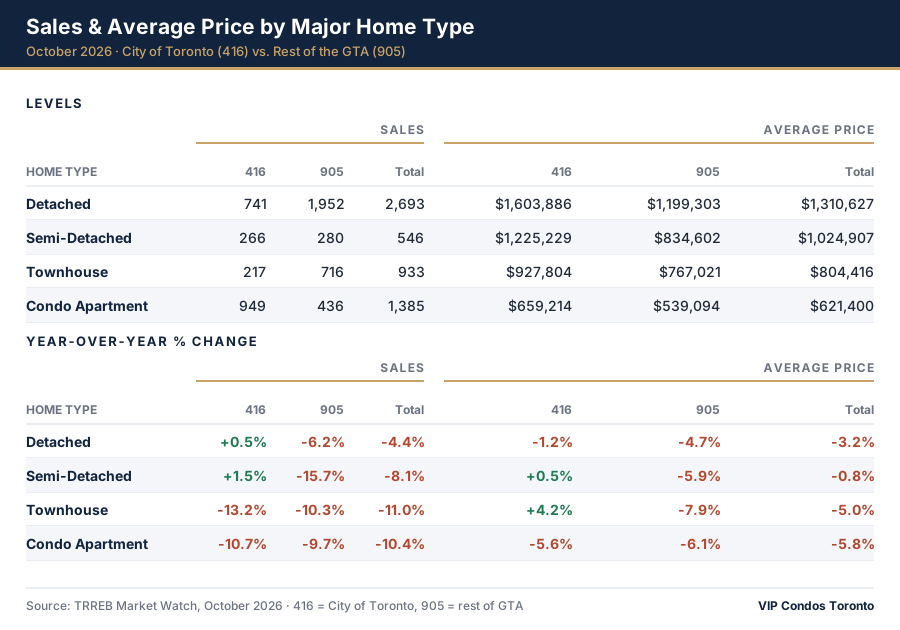
- Detached homes recorded 2,693 sales, down 4.4% year-over-year, at an average of $1,310,627 (down 3.2%). The 416 was the stronger half: City of Toronto detached sales actually rose 0.5% to 741 and prices eased just 1.2% to $1,603,886, while 905 detached sales fell 6.2% and prices 4.7% to $1,199,303.
- Semi-detached sales fell 8.1% to 546 and the average price was close to flat, down 0.8% to $1,024,907. Again the split was lopsided: 416 semis gained on both counts — sales up 1.5% to 266 and price up 0.5% to $1,225,229 — while 905 semi sales dropped 15.7%, the steepest fall anywhere in the table.
- Townhouses recorded 933 sales, down 11.0%, at an average of $804,416 (down 5.0%). The 416 townhouse average price was the month's largest gain, up 4.2% to $927,804, even as 416 townhouse sales fell 13.2%.
- Condo apartments recorded 1,385 sales, down 10.4% — the weakest sales result of any major home type — at an average of $621,400 (down 5.8%). The City of Toronto accounted for 949 of those sales, just over two thirds of all GTA condo transactions, at an average of $659,214.
- In the City of Toronto overall, 2,184 homes sold at an average price of $1,075,627, with sellers getting 98% of asking and properties moving in 30 days on their current listing.
The Economic Backdrop
- Bank of Canada overnight rate: 2.5%, up from 2.3% a month earlier. Prime rate: 4.5%.
- Posted mortgage rates: 5.49% (1-year), 6.05% (3-year), 6.19% (5-year) — the five-year rate ticked up from 6.09% in September.
- Inflation (year-over-year CPI growth): 3.1%. Real GDP growth: 3.3% annualized in Q2 2026.
- Toronto employment growth: 2.1%. Toronto unemployment rate (seasonally adjusted): 6.9%.
What TRREB Is Saying
TRREB President Daniel Steinfeld looked past the month's numbers to what could unlock the market. A Canada-U.S. trade deal, he argued, would give GTA residents a clearer picture of the economic outlook, and combined with a resolution to the conflict in the Middle East it could ease concerns about inflation and economic uncertainty, “strengthen consumer confidence and renew interest in homeownership as we move into 2027.”
Chief Information Officer Jason Mercer framed the year as a buyer's one. GTA homebuyers, he said, continued to benefit from “substantial negotiating power on price” over the past twelve months. Borrowing costs have risen on the back of higher inflation, but in his view the effect on monthly mortgage payments has been offset by lower selling prices, which has kept affordability broadly in check.
CEO John DiMichele pointed to the longer horizon, noting that short-term volatility in the ownership market should not obscure the fact that “the permanent population will continue to grow in our region.” He singled out HST rebates and development charge reductions as policy moves that should help bring a greater diversity of ownership and rental supply online over the medium term, so that new families are properly and affordably housed.
What This Means for Buyers and Sellers
For buyers: the discount is still there, but it is narrowing. The average price is down 2.7% year-over-year versus 5.1% a month ago, and the HPI Composite decline eased from 4.7% to 4.3%. More to the point, prices rose month-over-month on a seasonally adjusted basis, after slipping in September. Meanwhile selection keeps shrinking: new listings are down 11.9% and active listings 10.0%, both faster than the 7.9% drop in sales. Sellers are taking 97% of asking and homes are selling in 31 days on their current listing. If you have been waiting for the bottom, this is the month the market stopped obviously falling — and the cost of waiting is now choice as well as price.
For sellers: this was a better month than the headline suggests. Fewer competing listings, a shallower price decline, properties selling a day faster than last October, and a seasonally adjusted uptick in both sales and prices. That said, buyers are still cautious and there is no sign of a bidding-war market: 97% of asking is the GTA average, and borrowing costs went up rather than down this month. Price to today's market from day one and the shorter supply works in your favour; price to 2025 and you will be the listing that sits.
For condo investors: the condo apartment segment was the weakest major home type this month, with sales down 10.4% and prices down 5.8% — and condos took 38 days to sell on their current listing versus 31 across all home types. The notable change from September is that the 416 and the 905 have converged. Last month the 905 condo market fell roughly twice as hard as the 416 on both sales and price; in October the 416 was down 10.7% in sales and 5.6% in price while the 905 was down 9.7% and 6.1% — essentially the same market. The 416 still absorbed 949 of the GTA's 1,385 condo sales, just over two thirds of all activity, and at $659,214 the City of Toronto average remains 22% above the $539,094 905 average. The gap that mattered in September was geography; in October it is home type — detached and semi-detached in the 416 posted outright gains while condos fell everywhere. If you are weighing a downtown resale or an assignment, the 416's depth of buyers is still the argument for it, but the condo segment as a whole is where the softness now sits.
In order for you to use these monthly market updates to your advantage, our informative guide for buying pre-construction properties can be found under the Resources tab in the top right corner of this page. It will answer common questions such as:- How do I get my down payment?
- Can I use my RRSP for my down payment?
- How can I make the profits from my pre-construction purchases tax-free?
- What type of home or mortgage can I afford?
- Which incentives are available for first-time buyers?
- What is a PDI?
- What are the pros & cons of buying or selling an assignment before closing?
This summary is for general informational purposes and does not constitute legal, financial, or tax advice. Every situation is different — always consult a licensed real estate professional, lawyer, and tax advisor before making any decisions.
Ready to Take the Next Step?
Create your free, secure account at www.VIPCondosToronto.net for full MLS access, real-time sold data, and VIP pre-construction pricing and floor plans — the same tools our team uses every day.
For personalized advice on your specific Toronto buying or selling situation, contact Frank Merigliano and the VIP Condos Toronto team directly:
Phone: 416-885-0172
Email: frank@vipcondostoronto.net
Web: www.VIPCondosToronto.net
Frank Merigliano, Team Leader / Sales Representative, VIP Condos Toronto, RE/MAX PREMIER INTERNATIONAL INC., Brokerage — licensed since 1993, with RE/MAX since 1995, and a Top 50 RE/MAX team in Canada since 2015.
Sources: TRREB Market Watch and the October 2026 Market Watch report (PDF), Toronto Regional Real Estate Board, released November 4, 2026.
Have questions?
Want to know more about Real Estate Market Watch – October 2026? Send me a message and I'll get back to you within 24 hours.