
Real Estate Market Watch: Residential Transactions
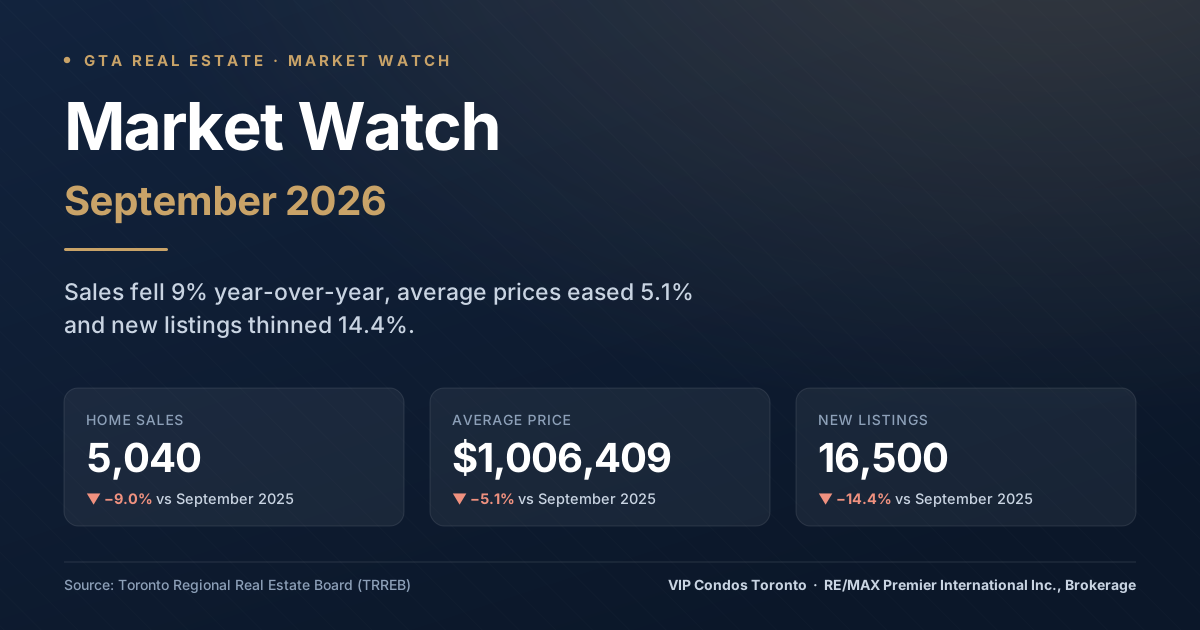
- 5,040 residential home transactions took place across the GTA in September 2026, down from 5,540 in September 2025 — a decrease of 9.0% year-over-year.
- On a seasonally adjusted basis, September sales were down month-over-month compared to August 2026.
- Total dollar volume for the month was just over $5.07 billion.
- TRREB attributed the pullback to a holding pattern among homebuyers, with uncertainty around the economy, inflation and borrowing costs weighing on demand.
September 2026 Real Estate News: Average Selling Prices
- The average sale price for September 2026 was $1,006,409. This is a decrease of 5.1% from September 2025, when it was $1,060,036 — narrowly holding above the $1 million mark.
- The median selling price was $860,000.
- The MLS® Home Price Index (HPI) Composite benchmark was down 4.7% year-over-year.
- On a seasonally adjusted basis, both the HPI Composite and the average selling price edged lower month-over-month compared to August 2026.
Monthly Market Update: New Listings and Inventory
- There were 16,500 new listings in September 2026, a 14.4% decrease from September 2025 (when there were 19,270).
- Active listings at month end totalled 26,131, down 9.3% from 28,813 a year earlier.
- The sales-to-new-listings ratio (trend) was 37.8%, with 4.6 months of inventory — still balanced territory, but supply is withdrawing faster than demand.
- New listings were also down month-over-month on a seasonally adjusted basis, so this was not simply a seasonal lull.
Real Estate Market Watch for September 2026: Days On The Market
- Properties spent an average of 51 days on the market in total (average PDOM), unchanged from September 2025.
- On their current listing, homes took an average of 34 days to sell (average LDOM), up from 33 days a year earlier — an increase of 3.0%.
- Sellers received an average of 98% of their asking price across the GTA.
Sales and Average Price by Home Type
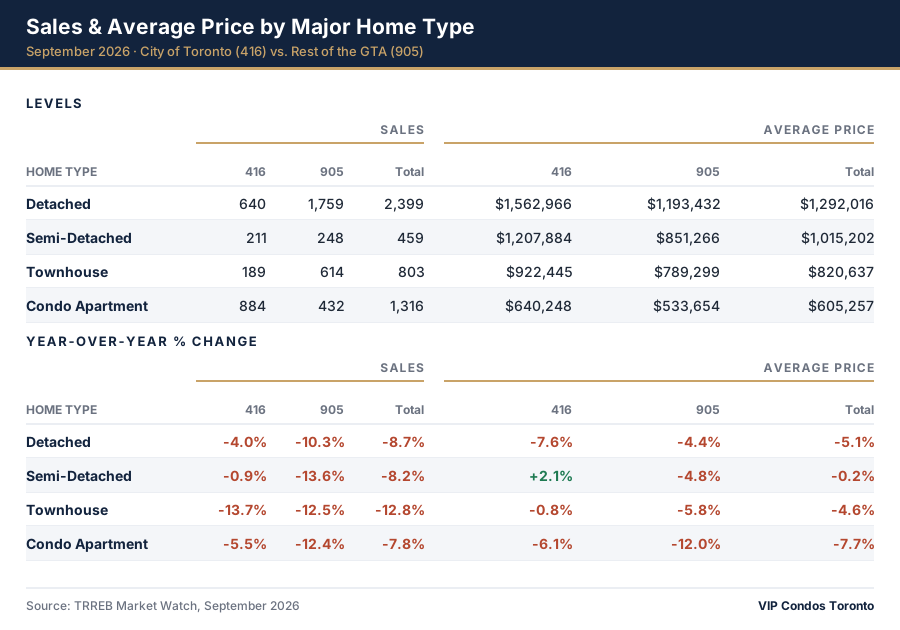
- Detached homes recorded 2,399 sales, down 8.7% year-over-year, at an average of $1,292,016 (down 5.1%). The split was uneven: 416 detached prices fell 7.6% to $1,562,966, while 905 detached prices held up better, easing 4.4% to $1,193,432.
- Condo apartments recorded 1,316 sales, down 7.8%, at an average of $605,257 (down 7.7%). The City of Toronto accounted for 884 of those sales — just over two thirds of all GTA condo transactions — at an average of $640,248.
- Townhouses saw the steepest decline in volume, with sales down 12.8% to 803 and the average price down 4.6% to $820,637.
- Semi-detached sales fell 8.2% to 459 while the average price was essentially flat, down 0.2% to $1,015,202 — and 416 semis were the month's only gain anywhere in the table, up 2.1% to $1,207,884.
- In the City of Toronto overall, 1,937 homes sold at an average price of $1,034,320, with sellers getting 99% of asking and properties moving in 45 days.
The Economic Backdrop
- Bank of Canada overnight rate: 2.3%. Prime rate: 4.5%.
- Posted mortgage rates: 5.49% (1-year), 6.05% (3-year), 6.09% (5-year).
- Inflation (year-over-year CPI growth): 3.0%. Real GDP growth: 3.3% annualized in Q2 2026.
- Toronto employment growth: 1.7%. Toronto unemployment rate (seasonally adjusted): 6.8%.
What TRREB Is Saying
TRREB President Daniel Steinfeld put the focus on politics rather than rates this month, noting that “housing is one of the biggest issues on voters' minds” and that the coming municipal election will shape housing policy across the GTA and Simcoe County for the next four years. The decisions the next mayors and councillors make on affordability, housing supply and the costs of buying a home can influence buyer demand and confidence directly.
Chief Information Officer Jason Mercer argued the demand has not disappeared, only paused, pointing to “substantial pent-up demand in the GTA” among households that fully intend to purchase in the months ahead. These would-be buyers want to take advantage of today's more affordable market, in his view, but need confidence that their employment situation will remain solid and that inflation will not push borrowing costs higher over the long term.
CEO John DiMichele called on governments to make homeownership more attainable by reducing barriers such as Toronto's Municipal Land Transfer Tax and opposing its expansion across the GTA and Simcoe County. With trade uncertainty and tariffs continuing to affect Canada's economy, he said “maintaining a strong housing sector is critical” to supporting consumer confidence, economic growth and the significant spin-off spending generated by every MLS® transaction.
What This Means for Buyers and Sellers
For buyers: on paper this is your month — the average price is down 5.1% year-over-year, the HPI Composite is down 4.7%, and sellers are accepting 98% of asking. The catch is selection. New listings fell 14.4% and active listings 9.3%, both well ahead of the 9.0% drop in sales, so the inventory that made the past year comfortable for buyers is thinning out. Waiting for certainty on rates and the economy has a cost, and this month that cost is choice.
For sellers: fewer competing listings is genuinely in your favour, and it is the main reason prices are easing rather than falling hard. But buyers are hesitant, not absent: homes still took 34 days to sell on their current listing and 51 days in total, and both the HPI and the average price slipped again month-over-month on a seasonally adjusted basis. Pricing to today's market from day one — not to last spring's — is what separates a sale from a listing that sits.
For condo investors: the 416 clearly outperformed the 905 this month. City of Toronto condo apartment sales fell 5.5% with prices down 6.1% to $640,248, while 905 condo sales dropped 12.4% and prices there fell 12.0% to $533,654 — roughly double the decline on both counts. The 416 also absorbed 884 of the GTA's 1,316 condo sales, just over two thirds of all activity. If you are weighing a downtown resale or an assignment against a suburban unit, that gap is the number to look at: location within the GTA is doing more work than it has in years, and the suburban condo market is where the real softness is.
In order for you to use these monthly market updates to your advantage, our informative guide for buying pre-construction properties can be found under the Resources tab in the top right corner of this page. It will answer common questions such as:- How do I get my down payment?
- Can I use my RRSP for my down payment?
- How can I make the profits from my pre-construction purchases tax-free?
- What type of home or mortgage can I afford?
- Which incentives are available for first-time buyers?
- What is a PDI?
- What are the pros & cons of buying or selling an assignment before closing?
This summary is for general informational purposes and does not constitute legal, financial, or tax advice. Every situation is different — always consult a licensed real estate professional, lawyer, and tax advisor before making any decisions.
Ready to Take the Next Step?
Create your free, secure account at www.VIPCondosToronto.net for full MLS access, real-time sold data, and VIP pre-construction pricing and floor plans — the same tools our team uses every day.
For personalized advice on your specific Toronto buying or selling situation, contact Frank Merigliano and the VIP Condos Toronto team directly:
Phone: 416-885-0172
Email: frank@vipcondostoronto.net
Web: www.VIPCondosToronto.net
Frank Merigliano, Team Leader / Sales Representative, VIP Condos Toronto, RE/MAX PREMIER INTERNATIONAL INC., Brokerage — licensed since 1993, with RE/MAX since 1995, and a Top 50 RE/MAX team in Canada since 2015.
Sources: TRREB Market Watch and the September 2026 Market Watch report (PDF), Toronto Regional Real Estate Board, released October 6, 2026.
Have questions?
Want to know more about Real Estate Market Watch – September 2026? Send me a message and I'll get back to you within 24 hours.